Research Article
Development of an immunochromatographic assay for detection of Aflatoxin B1 in corn and rice
Desarrollo de un ensayo inmunocromatográfico para la detección de aflatoxina B1 en maíz y arroz
Chu Duc Tien1 https://orcid.org/0009-0008-7922-4600
Nguyen
Thi Thu Trang2 https://orcid.org/0000-0002-4859-8991
Le
Tuan Anh2
https://orcid.org/0000-0001-6288-9077
Hoang
Thi Truong2 https://orcid.org/0000-0001-7118-7122
Nguyen
Van Chuyen2*
https://orcid.org/0000-0001-9507-8377
Nguyen
Hoang Trung2
https://orcid.org/0000-0003-3527-7037
Vu
Thi Hoa2 https://orcid.org/0009-0002-4863-0653
Nguyen
Trong Dat3 https://orcid.org/0009-0005-9395-8422
Nguyen
Thi Minh Ngoc4
https://orcid.org/0000-0002-7652-659X
Nguyen
Ngoc Tuan5 https://orcid.org/0009-0003-3020-5736
Nguyen
Van Ba6 https://orcid.org/0000-0001-8603-2035
1Vietnam
Military Medical University. Department of Military Political. Hanoi, Vietnam.
2Vietnam
Military Medical University. Department of Military Hygiene. Hanoi, Vietnam.
3Military
Institute of Preventive Medicine. Hanoi, Vietnam.
4Haiphong
University of Medicine and Pharmacy. Faculty of Public Health. Haiphong, Vietnam.
5Vietnam
Military Medical University. Department of Immunology. Hanoi, Vietnam.
6Vietnam
Military Medical University. Department of Military Science. Hanoi, Vietnam.
*Author for Correspondence. Email: nguyenvanchuyenk40@gmail.com
Introduction:
Aflatoxin B1 is a toxic contaminant, a threat to human health. Its presence
in food was common. Rapid and efficient determination of AFB1 in corn and rice
is critical for food safety monitoring.
Objectives: To develop a highly sensitive sandwich immunochromatographic
assay for the detection of aflatoxin B1, with greater sensitivity than the strip
test.
Methods: During sample preparation, aflatoxin B1 bound to bovine serum
albumin to form AFB1-BSA conjugates, captured by both the anti-BSA antibody
on the conjugate pad and the anti-AFB1 antibody on the test line, forming a
sandwich structure. Key parameters were optimized to achieve the highest sensitivity
of the test strip. Optimal parameters include: Saturation of the antibody coating
on magnetic nanoparticles, suitable nitrocellulose membrane, and optimal antibody
concentration on the test line.
Results:
Test strips were developed for the rapid detection of aflatoxin B1 in maize
and rice. Detection limits: 1.0 µg/L for aflatoxin B1 in the assay buffer and
1.6 µg/L for aflatoxin B1 in spiked maize and rice samples. Repeatability: 5/5
for 5 aflatoxin B1 concentrations analyzed; test strip stability was 6 months
when stored at 4°C and 25°C.
Conclusion:
The immunochromatographic assay provides an efficient and highly sensitive approach
for the in situ detection of AFB1 in maize and rice.
Keywords: Aflatoxin B1; immunochromatographic assay; magnetic nanoparticles; sensitivity.
Introducción:
Aflatoxina B1 es un contaminante tóxico; una amenaza para la salud humana. Su
presencia en los alimentos era común. La determinación rápida y eficaz de AFB1
en maíz y arroz es fundamental para el control de la inocuidad alimentaria.
Objetivos:
Desarrollar un ensayo inmunocromatográfico tipo sándwich, de alta sensibilidad,
para detectar aflatoxina B1, con mayor sensibilidad que la prueba de tira.
Métodos:
Durante la preparación de la muestra, la aflatoxina B1 se unió a la albúmina
sérica bovina, para formar conjugados AFB1-BSA, capturados tanto por el anticuerpo
anti-BSA en la almohadilla de conjugado, como por el anti-AFB1 en la línea de
prueba, para formar una estructura tipo sándwich. Se optimizaron los parámetros
clave para lograr mayor sensibilidad de la tira de prueba. Los parámetros óptimos
incluyen: Saturación del recubrimiento de anticuerpos sobre nanopartículas magnéticas,
membrana de nitrocelulosa adecuada y concentración óptima de anticuerpos en
la línea de prueba.
Resultados:
Se desarrollaron tiras de prueba para la detección rápida de aflatoxina B1 en
maíz y arroz. Límites de detección: 1,0 µg/L para la aflatoxina B1 en el tampón
de análisis y de 1,6 µg/L para la aflatoxina B1 en muestras de maíz y arroz
enriquecidas. Repetibilidad: 5/5 para 5 concentraciones analizadas de aflatoxina
B1; la estabilidad de la tira de prueba fue de 6 meses cuando se almacenó a
4 0C y 25 0 C.
Conclusión:
El ensayo inmunocromatográfico proporciona un enfoque eficaz y altamente sensible
para la detección in situ de AFB1 en maíz y arroz.
Palabras clave: Aflatoxina B1; ensayo inmunocromatográfico; nanopartículas magnéticas; sensibilidad.
Received: 06/12/2024
Approved:
10/05/2025
INTRODUCTION
Aflatoxin B1 (AFB1) is a toxic secondary metabolite produced by several strains of fungi, like Aspergillus flavus and A. parasiticus.(1) Exposure to AFB1 is associated with a risk of hepatocellular carcinoma. It is categorized as a group 1 human carcinogen by the International Agency for Research on Cancer.(2) AFB1 is widely found as contaminants in a great variety of unprocessed foods, such as cereals, nuts, coffee, etc. Contaminated AFB1 food products can pose serious hazard to human health. For protecting the health of consumers, detection of food products contaminated with AFB1 is necessary.
Several analytical methods, such as high-performance liquid chromatography (HPLC), liquid chromatography-mass spectrometry (LC-MS), gas chromatography-mass spectrometry (GC-MS), and enzyme-linked immunosorbent assay (ELISA), have been developed to analyze AFB1 in food.(3) However, these methods are time-consuming as well as require expensive equipment and skilled technicians. Lateral flow immunochromatography assay (LFIA), which is another perspectively more efficient method has been studied and developed.
Magnetic nanoparticles (MNPs), which are relatively new and inexpensive, are recently employed to develop LFIAs with both qualitative (optical signal) and quantitative (magnetic signal) capabilities. However, MNPs can easily be oxidized in air, and have poor solubility, dispersibility and biocompatibility. Gold coated MNPs is an option to reduce these limitations. Therefore, Fe3O4@Au magnetic nanoparticles (MNPs) has been used as color indicators in the present study.
The objective of this resarch was to develop a high-sensitivity sandwich-based immunochromatographic assay for the detection of aflatoxin B1 in corn and rice samples, with greater sensitivity than the strip test.
METHODS
Chemicals and Materials
Anti-AFB1 monoclonal antibodies (OAEF00325; Biotrend), Anti- bovine serum albumin monoclonal antibodies (abx179053; Abbexa), were used. Anti-Mouse IgG antibodies (M5899), bovine serum albumin (BSA), Aflatoxin B1, 1-ethyl-3-(3-dimethyllaminopropyl)-carbodiimide hydrochloride (EDC) and N-hydroxy-succinimide (NHS), were purchased from Sigma, Germany. The following membranes were used: Nitrocelullose membranes (HF075MC100, HF090MC100, HF120MC100, Merck; Germany); conjugate pad (Standard 17 whatman; USA).
Principle of the method
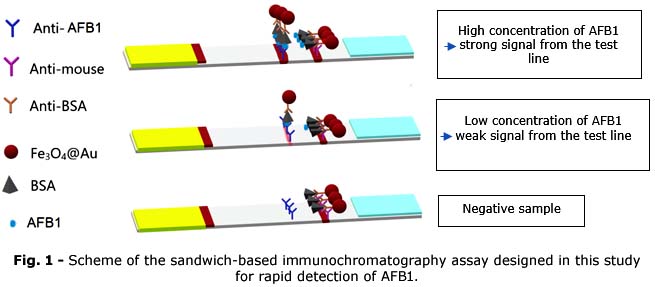
The LFIA has developed using Fe3O4@Au (MNPs) as color indicator, and based on antigen-antibody reactions to form a sandwich structure. As illustrated in figure 1, anti-AFB1 is immobilized on the detection line (the test line). When sample solution flows into the conjugate pad, the anti-BSA antibody coating on MNPs bind to BSA, which has previously been attached to the target antigen AFB1 during sample processing. The formed complexes (MNPs-antibody-antigen) migrate to the nitrocellulose membrane and are captured by anti-AFB1 antibodies present in the test line. The remaining complexes then continue to migrate to the control line, where they are captured by the goat anti-mouse antibody. If the target antigen AFB1 is present in the test sample, the signal must be observed both the control and test lines. Besides, the intensity of the signal from the test line is proportional to the concentration of AFB1 in the test sample.
Optimization of the immunochromatographic strip
Synthesis of the Fe3O4@Au magnetic nanoparticles
Firstly, Fe3O4@PEI with a diameter of approximately 100 nm was directly synthesized.(4) 0.68 g of FeCl3.6H2O was dissolved in EG under magnetic stirring at 600C for 10 min. After that, sodium acetate and 1 g of PEI were dissolved in 10 mL EG. Subsequently, these two mixtures were vigorously stirred at 600C for 20 min, and then transferred to a Teflon thermos flask to react at 2200C for 2 h.
Next, Fe3O4@Au (MNPs) was synthesized. First, 2 mg Fe3O4@PEI was dispersed in 37.5 mL water and then 12.5 mL HAuCl4solution (6 mM) was added to mixture. The solution was heated at 800C for 10 min under vigorous mechanical stirring. After that, sodium citrate was rapidly added to the flask and stirred for another 20 min. As a result, Fe3O4@Au MNPs were formed. The morphology and size of synthesized MNPs were observed by transmission electron microscopy (TEM).
Saturation of the antibody coating on Fe3O4@Au MNPs and determination of the detection limit of the test strip
The process of antibodies binding to Fe3O4@Au MNPs included two steps: Activating the carboxyl group on the MNPs' surface and covalently binding to the antibody. Firstly, Fe3O4@Au-COOH was activated with EDC and NHS. The anti-BSA antibody was then added and incubated at 25 0C for 60 min. After the washing steps, the MNPs-antibody was blocked in Borat pH 7.2, containing 2% glycine.
Different antibody concentrations (25 µg/mL, 50 µg/mL, 75 µg/mL, 100 µg/mL, 125 µg/mL, 150 µg/mL, and 175 µg/mL) were added to 1 mg of Fe3O4@Au MNPs to determine optimal concentration.
The amount of antibody coating on Fe3O4@Au MNPs was determined by UV-Vis spectroscopy. First, the adsorption peaks for MNPs-antibody and the free MNPs were compared to confirm that MNPs were successfully coated with the antibody. A standard curve was next constructed using different concentrations of the protein standard. By interpolation from the constructed standard curve, the amount of antibody coating on Fe3O4@Au MNPs was determined indirectly through the amount of residual antibody in the solution.
Dispersity, hydrodynamic size and zeta potential of MNPs before and after antibody coating were measured using a Litesizer DLS 100. The optimal antibody concentration was the sample with the strongest color signal intensity on the test line when tested on a positive sample with an antigen concentration of 2 µg/L.
The determined optimal antibody concentration was subsequently used to prepare LFIA for figuring out the detection limit. Concentrations of AFB1 standard solution, including 0 µg/L, 0.5 µg/L, 1.0 µg/L, 10 µg/L, 100 µg/L and 200 µg/L, were tested.
Selection of nitrocellulose membrane
HF075MC100, HF090MC100, HF120MC100 membranes were compared to find out which membrane is the best to develop LFIA for detection of AFB1. The test strips then were prepared and tested with AFB1 samples at a concentration of 2.0 µg/L. These nitrocellulose membranes were evaluated to identify the optimal membrane for AFB1 detection. The most suitable membrane was defined as having a high sensitivity and no false positives.
Optimization of the antibody concentration on the test line
The following antibody concentrations on the test line: 1.2 mg/mL, 1.0 mg/mL, 0.8 mg/mL, and 0.6 mg/mL. Samples with AFB1 at a concentration of 2.0 µg/L were used to determine which antibody concentration on the test line gives the strongest color signal. 60 µL of a running buffer (15 mM pH 7.4 PBS comprising 0.6% glycine, and 1% Tween 20) was used for each test.
Analytical performance evaluation of the LFIA
The rapid detection efficiency of the LFIA was determined by parameters: Limit of detection (LOD), stability, and repeatability.
Determination of detection limit on experimental samples containing AFB1
Preparation of AFB1-spiked food
The negative samples were confirmed by HPLC method. Blank corn and rice samples were spiked with AFB1 standard solution at different concentrations of 1.0 µg/L, 1.6 µg/L, 10 µg/L, 100 µg/L, or 200 µg/L. The samples were then tested on the LFIA test strip. The LOD is the lowest AFB1 concentration that can be detected by the LFIA test strip. The LOD results in PBS buffer solution were used to compare with the sensitivity in experimental samples spiked with AFB1 standard solution.
Determine the stability of the LFIA
The developed LFIA were sealed in bags with silica gel and stored under different temperature conditions (40C, 250C, and 370C). After 1 month, 3 months, and 6 months of storage, the LFIA was used for AFB1 detection in positive samples, and its stability was determined by the change of color intensity of the test line. To check for stability and false negatives, we ran each parameter five times with samples of rice and maize having AFB1 antigen at a concentration of 2 µg/L. To check for false positives, we ran each parameter five times with blank samples.
Repeatability of the LFIA
The repeatability of the test strip was determined by the results of AFB1 detection in corn and rice samples, each of which was spiked with AFB1 at a concentration of 1.0, 1.6, 10, and 100 µg/L.
Samples preparation
One gram of crushed corn or rice samples was mixed with 5 mL of methanol-PBS (7:3; v/v). Then centrifuged at 1600 rpm for 5 min.
Conjugation of AFB1 to BSA
AFB1-BSA conjugate was synthesized using the oxime active ester (OAE).(5) AFB1 in the food sample and 12 mg of CMO (0.06 mM) were dissolved in 5 mL of pyridine and incubated at 370C for 1 hour in the dark under stirring. Then, AFB1 oxime was dissolved in 1.0 mL of DMF, followed by the addition of 10 mM EDC and 10 mM NHS. The activated solution was slowly added to the BSA (20 mg/mL) solution under stirring for 1 hour. The resulting mixture was used for LFIA.
RESULTS
Description of Fe3O4@Au (MNPs)
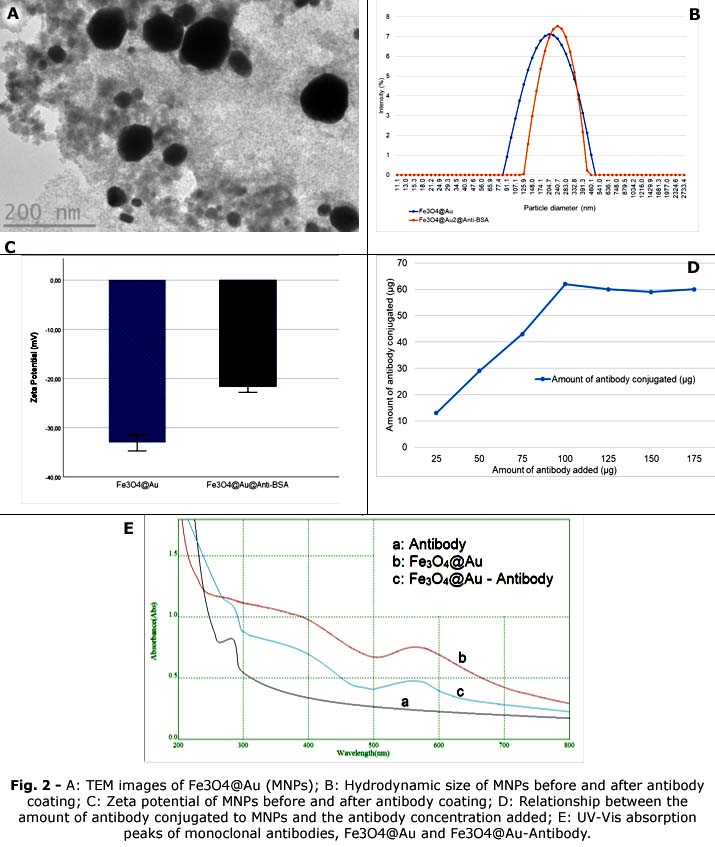
The diameter, dispersion, gold nanoparticles layer, and stability of MNPs affect the sensitivity, and reaction time of LFIA, so was observed the synthesized MNPs under transmission electron microscopy (TEM). The formed monodisperse Fe3O4@Au MNPs had a spherical shape with an average diameter of about 100 nm (Fig. 2A). The MNPs dispersed well, and gold nanoparticles formed a layer that covered the MNPs completely. These TEM images show that Fe3O4@Au MNPs were successfully synthesized.
Saturation of the detection antibody coating on Fe3O4@Au (MNPs) and detection limit of the test strip
The hydrodynamic size of the MNPs before antibody coating was 210.5 nm and increased to 244.3 nm after conjugation with detection antibody (Fig. 2B). Furthermore, the zeta potential of the MNPs to explore the surface electric charge before and after antibody coating, which were -32.7 mV and -21.8 mV, respectively (Fig. 2C). The hydrodynamic size and the zeta potential increased demostrated that the antibody was successfully attached to the nanoparticle surface.
Fig. 2D shows the amount of antibody molecules binding to MNPs increased as the amount of antibody added increased as long as it was lower than 100 µg/mL. When the amount of antibody added was higher than 100 µg/mL, the amount of antibody molecules binding to MNPs did not increase significantly (p> 0.05). This indicated that saturation of anti-BSA antibody coating on MNPs was achieved. Therefore, the optimal antibody concentration we selected as 100 µg/mL for 1 mg of gold-coated magnetic beads and the amount of conjugated antibody was approximately 62 µg.
Furthermore, was compared the adsorption peaks for MNPs-antibody and the free MNPs. The results showed that there was no adsorption peak in the wavelength range of 270 - 280 nm with the free MNPs, while an adsorption peak for MNPs-antibody was observed at the wavelength of 270 nm (Fig. 2E). This confirms that the antibody has conjugated to MNPs'surface.
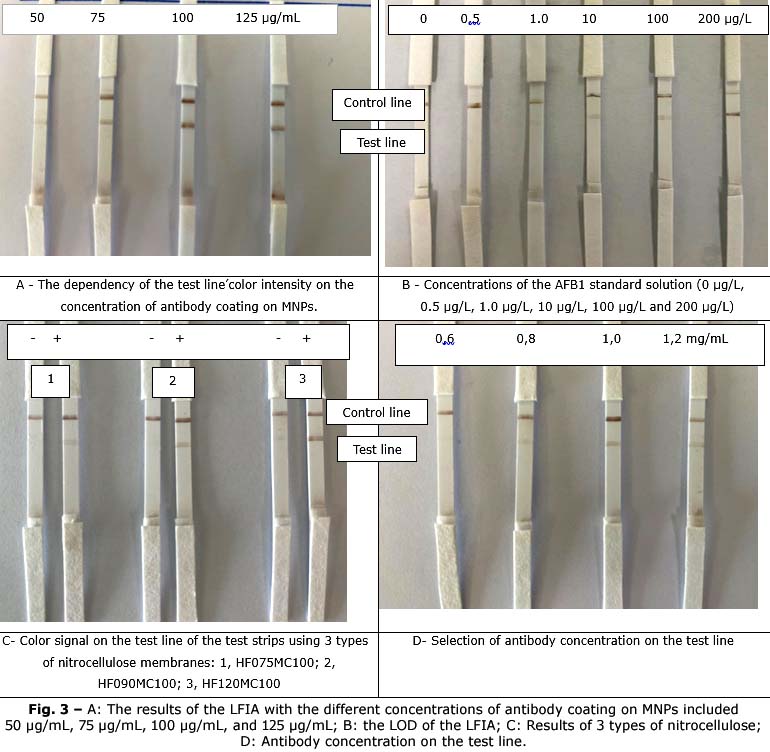
The MNPs-antibodies, which were obtained after adding anti-BSA antibody with concentrations of 50 µg/mL, 75 µg/mL, 100 µg/mL, 125 µg/mL, were used to prepare the test strips for AFB1 detection in the sample with 2 µg/L AFB1. The test results showed that increasing the concentration of added antibodies resulted in an increase in the color intensity on the test and control lines (Fig. 3A). This suggested that high density of antibody covering MNPs'surface increased the efficiency of the antigen-antibody interaction. The LOD of LFIA in our study was 1.0 µg/L (Fig. 3B). Since the allowable standard of AFB1 in the samples is 5 µg/Lfor rice products, 2 µg/L processed rice products,(6) this LFIA can be a useful tool for the detection of AFB1 in corn and rice samples.
Selection of nitrocellulose membrane
As shown in figure 3C, all three test strips gave positive results, but the color signal on the test line of the test strip using HF075MC100 membrane was the weakest. On HF075MC100 membrane the time MNPs-antibody-antigen flow through the test line was not enough for efficient antigen-antibody interaction. In contrast, on HF120MC100 membrane with high capillary flow times can lead to a higher sensitivity, but false positive results may occur due to non-specific adsorption. Therefore, HF090MC100 membrane was the best choice for LFIA.
Selection of antibodyconcentration on the test line
As shown in figure 3D, the color intensity of the test line increased with increasing antibody concentration and reached a peak value at antibody concentration of 1 mg/mL and then decreased significantly at concentration of 1.2 mg/mL. Therefore, the antibody concentration of 1 mg/mL was chosen.
Analytical performance evaluation of the LFIA
Results of LOD of the LFIA on corn and rice samples
AFB1 concentrations of 0 µg/L, 0.5 µg/L, 1.0 µg/L, 10 µg/L, 100 µg/L and 200 µg/L were added to the PBS buffer. The resulting solutions were then tested to determine LOD of the LFIA (Fig. 4). The analysis was completed within 12 minutes. AFB1 concentrations of 0 µg/L was used in order to check for the presence of non-specific binding. The LOD of the LFIA was 1.0 µg/L in the PBS buffer (Fig. 4A).
Blank corn, and rice samples spiked with AFB1 concentrations of 0 µg/L, 1.0 µg/L, 1.6 µg/L, 10 µg/L, 100 µg/L and 200 µg/L were tested by the LFIA (Fig. 4B). The LOD of the LFIA was 1.6 µg/L in the spiked samples (Fig. 4A), which was higher than AFB1 in the PBS buffer. The intensity of the signal from the test line was proportional to the concentration of AFB1 in the test sample. However, in comparison with AFB1 in the PBS buffer at the same concentration, corn and rice samples gave lower test line's color intensity.
Stability of the LFIA
The LFIA still gave clearly positive results with an AFB1 concentration of 2 µg/L without the test line's color intensity decreasing after 6 months of storage at 40C and 250C. There were not false positive and false negative results. After 3 months of storage at 370C, the LFIA gave faded positive results with an AFB1 concentration of 2 µg/L, and the color intensity continuously decreased after 6 months of storage. However, false positive and false negative results weren't observed (table 1).
Repeatability of the LFIA
Five lots of the LFIA were used to assess their repeatability in food samples spiked with AFB1 concentrations of 1.0, 1.6, 10, and 100 µg/L.
DISCUSSION
Saturation of the detection antibody coating on Fe3O4@Au (MNPs) and detection limit of the test strip
The amount of antibody covering the MNPs plays an important role in determining the LOD and specificity of the LFIA. The concentration of anti-BSA conjugated to MNPs must be as high as possible to increase the efficiency of antigen binding, lower LOD, and avoid false positives. In current study, the antibody concentration was 100 µg/mL, the color signal on the test line was the most intense. Too high an antibody concentration on the surface of MNPs reduced the ability to bind to the antigen and recorded false positive results.
When testing LFIA with increasing antigen concentrations of 0 µg/L, 0.5 µg/L, 1.0 µg/L, 10 µg/L, 100 µg/L and 200 µg/L, the intensity of the color signal in the test line increased. For negative samples, no false positive was found. The smallest antigen concentration that produces a positive signal was 1.0 µg/kg, which was the LOD of the test strip. The test strip had good repeatability.
The LOD in this study was better than that in the previous studies on AFB1 toxin detection.(7,8) The reason for this difference might be the use of different methods. The previous studies developed competitive LFIA for AFB1 toxin detection;(7,8) while the sandwich LFIA, which was known as more sensitive than competitive mechanism, was used in current study.
The amount of MNPs-antibody sprayed on the conjugate pad to achieve the best sensitivity was optimized. If there was too little MNPs-antibody on the conjugate membrane, the amount of antibody was not enough to react completely with the target antigen. The amount of MNPs-antibody sprayed on the conjugate pad must be just enough to react completely with the antigen in the sample and create a clear color signal on the control line in both negative and positive samples. On the contrary, if too many MNPs - antibody were on the conjugated pad, a background signal may be generated on the nitrocellulose membrane, lead to increased nonspecific absorption.
Analytical performance evaluation of the LFIA
Limit of detection of the LFIA
Both the LOD of the LFIA in the PBS buffer and food samples were lower than the allowable standard of AFB1 in cereals(7) (Fig. 4). Current results indicated that the sensitivity of LFIA for AFB1 detection in PBS buffer solution was better than that in corn and rice samples. In addition, the intensity of the color signal of the LFIA tested in the food-spiked samples was slightly weaker than that in the PBS solution. These results demonstrated that the LFIA could be applied for AFB1 detection analysis of corn and rice samples.
Stability and repeatability of the LFIA
These results indicated that the LFIA can be stored at 40C and 250C for at least 6 months without losing their efficacy.
To evaluate the repeatability of the LFIA, five lots of the LFIA were used to assess their repeatability in corn and rice samples spiked with AFB1 antigen.
LFIAs employing Fe3O4@Au MNPs were used for qualitative analysis. Additionally, the magnetic can be used to enrich the antigen in the samples. Therefore, gold-coated MNPs with core-shell structure for the development of LFIAs was choosen.
A high-sensitivity sandwich-based immunochromatographic assay for rapid detection of AFB1 in corn, rice spiked samples have successfully developed. The LOD of the LFIA in the PBS buffer and food spiked samples were 1,0 µg/L and 1,6 µg/L, respectively. The stability of the test strips was 6 months if they were stored at 40C and 250C. Current results have shown that optimization of some experimental parameters plays an important role in the development of the LFIA test strips.
BIBLIOGRAPHIC REFERENCES
1. Caceres I, Al Khoury A, El Khoury R, Lorber S, Oswald I, El Khoury A, et al. Aflatoxin biosynthesis and genetic regulation: A review [Internet]. Toxins. 2020; 12(3):150. DOI: 10.3390/toxins12030150
2. IARC. Some traditional herbal medicines, some mycotoxins, naphthalene and styrene [Internet]. World Health Organization. 2002 [accesss: 27/11/2024]. Available at: https://publications.iarc.fr/Book-And-Report-Series/Iarc-Monographs-On-The-Identification-Of-Carcinogenic-Hazards-To-Humans/Some-Traditional-Herbal-Medicines-Some-Mycotoxins-Naphthalene-And-Styrene-2002
3. Singh J, Mehta A. Rapid and sensitive detection of mycotoxins by advanced and emerging analytical methods: A review [Internet]. Food science & nutrition. 2020; 8(5):2183-2204. DOI: 10.1002/fsn3.1474
4. Sun X, Chang J, Dong Q, Wang H, Zhang X, Li D, et al. Facile synthesis of Fe3O4@ polyethylenimine with peroxidase-like activity for highly sensitive detection of interferon a-2b [Internet]. Science China Materials. 2023; 66(10):4121-30. DOI: 10.1007/s40843-023-2549-3
5. Wang Y, Jiang J, Fotina H, Zhang H, Chen J. Advances in antibody preparation techniques for immunoassays of total aflatoxin in food [Internet]. Molecules. 2020; 25(18):4113. DOI: 10.3390/molecules25184113
6. QCVN 8-1:2011/BYT, National technical regulation on the limits of mycotoxin contamination in food [Internet]. Vietnam, Hanoi; 2011. [access 27/11/2024]. Available at https://vbpl.vn/FileData/TW/Lists/vbpq/Attachments/26964/VanBanGoc_02_2011_TT-BYT.pdf
7. Zhou Y, Pan F-G, Li Y-S, Zhang Y-Y, Zhang J-H, Lu S-Y, et al. Colloidal gold probe-based immunochromatographic assay for the rapid detection of brevetoxins in fishery product samples [Internet]. Biosensors and Bioelectronics. 2009; 24(8):2744-47. DOI: 10.1016/j.bios.2009.01.034
8. Liu B-H, Hsu Y-T, Lu C-C, Yu F-Y. Detecting aflatoxin B1 in foods and feeds by using sensitive rapid enzyme-linked immunosorbent assay and gold nanoparticle immunochromatographic strip [Internet]. Food Control. 2013; 30(1):184-9. DOI: 10.1016/j.foodcont.2012.07.008
Conflict of interest
The authors declared no potential conflicts of interest with respect to the research, authorship, and/or publication of this article.
Funding
This research was funded by the Vietnam Ministry of Science and Technology under grant number ÐTÐL.CN-05/19.
Authorship contribution
Conceptualization: Nguyen Van Ba, Nguyen Van Chuyen.
Data
curation: Chu Duc Tien, Nguyen Thi Thu Trang, Le Tuan Anh, Hoang Thi Truong,
Vu Thi Hoa, Le Tuan Anh, Nguyen Trong Dat.
Formal
analysis: Chu Duc Tien, Le Tuan Anh, Nguyen Ngoc Tuan.
Methodology
and Research: Chu Duc Tien, Nguyen Thi Thu Trang, Le Tuan Anh, Nguyen Trong
Dat.
Project
administration: Chu Duc Tien, Nguyen Van Ba, Nguyen Van Chuyen.
Supervision:
Nguyen Van Ba, Nguyen Van Chuyen.
Validation:
Nguyen Van Chuyen, Nguyen Hoang Trung.
Drafting
- Revision and editing: Nguyen Th? Thu Trang, Nguyen Thi Minh Ngoc, Nguyen
Hoang Trung.
Data Availability Statement
All data underlying the results are available as part of the article.
Supplementary file: Response to external peer review (PDF format). Available at: https://revmedmilitar.sld.cu/index.php/mil/libraryFiles/downloadPublic/49